Data Driven Web Design: Master Essential 2025
Why Data-Driven Web Design Is Your Competitive Edge
Data driven web design is a strategic approach that uses user data to inform every design decision—from layout and navigation to color schemes and call-to-action placement. Instead of relying on assumptions, you base choices on real evidence of what works for your users.
Quick Answer: What Is Data-Driven Web Design?
- Definition: Making design decisions based on analytics, user behavior, and testing rather than intuition alone.
- Key Data Types: Quantitative (metrics like bounce rates) and qualitative (user feedback, interviews).
- Essential Tools: Google Analytics, heatmaps, A/B testing platforms, user surveys.
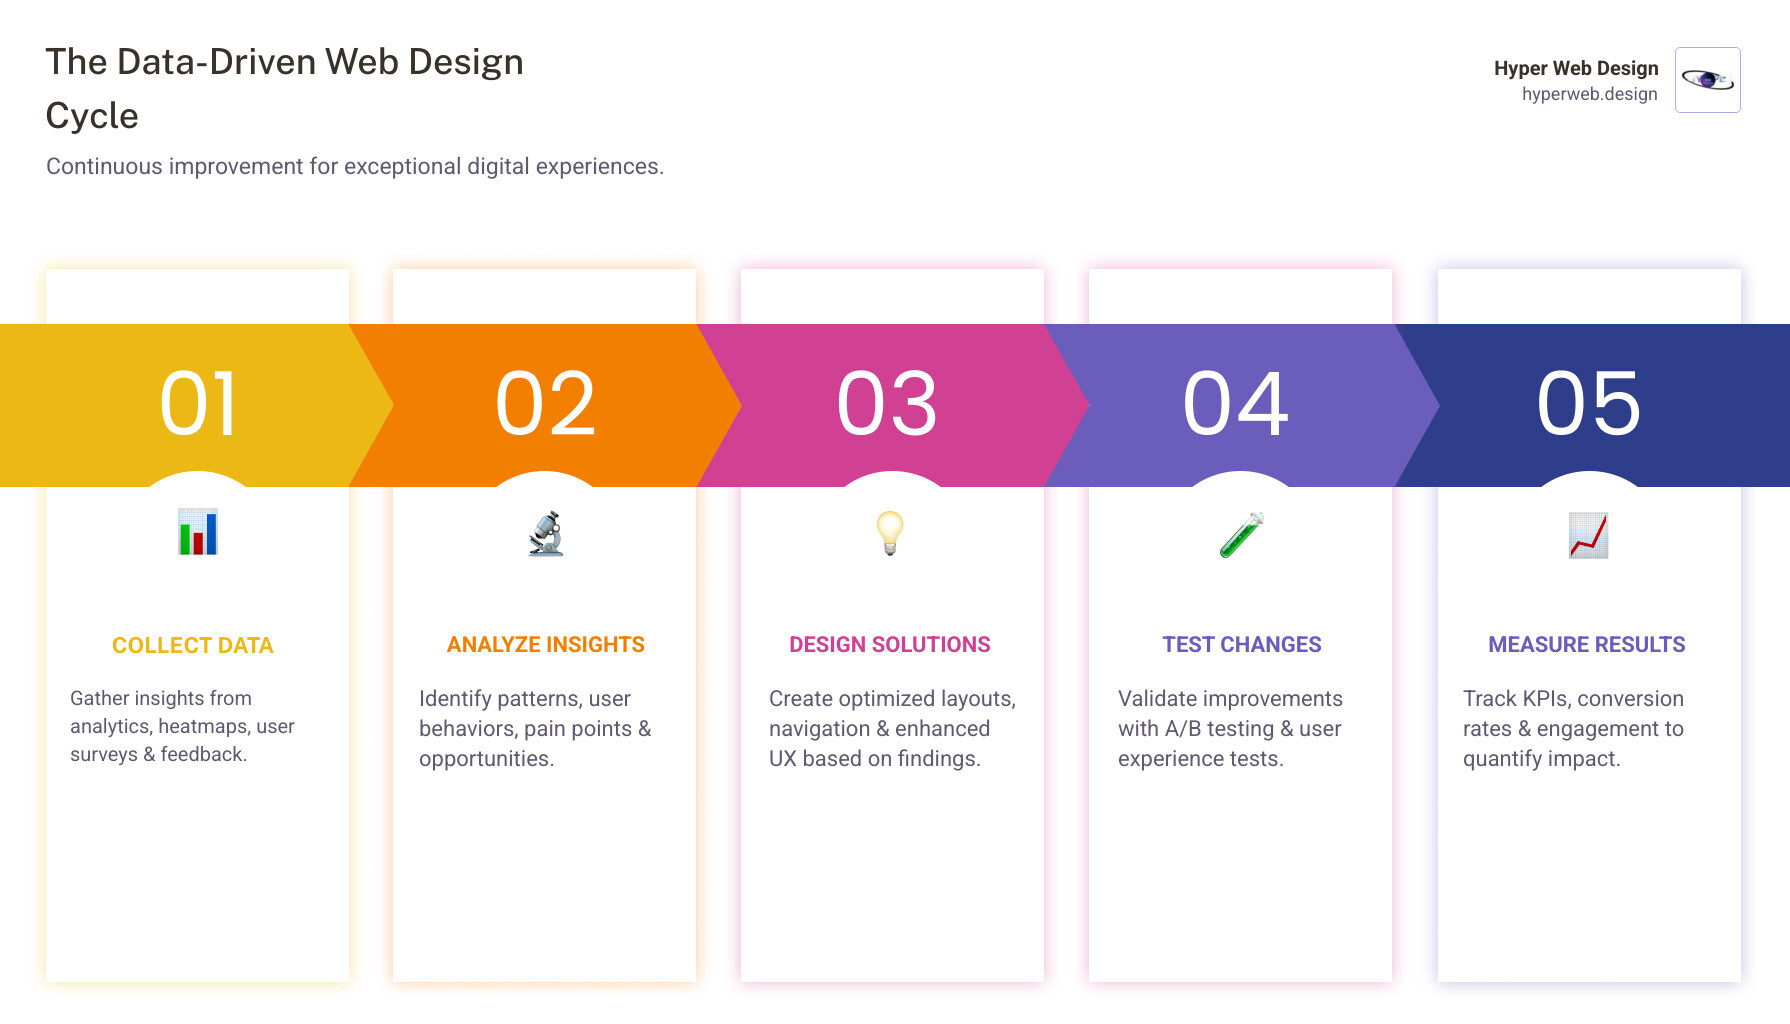
- Core Process: Collect data → Analyze patterns → Design solutions → Test changes → Repeat.
- Main Benefits: Higher conversion rates, better user experience, and increased ROI.
The days of designing websites based merely on visual components are over. Your website shapes 94% of the initial impression a customer has of your brand, yet many businesses make decisions based on what looks good rather than what performs well. The result? Poor mobile experiences that drive away 53% of visitors and beautiful designs that fail to convert.
For luxury brands, the stakes are even higher. 75% of visitors judge a company’s credibility based on its site design, and 38% will leave immediately if they find it confusing. Data changes this. Companies in the top third of their industry for data-driven decision-making are 5% more productive and 6% more profitable than competitors. Even small, data-informed improvements yield significant results, with some optimizations boosting conversion rates by up to 400%.
I’m Shawn Shameli, and for over a decade at Hyper Web Design, I’ve helped luxury brands transform their digital presence through data driven web design. We combine creative vision with quantitative insights to create websites that don’t just look exceptional—they deliver measurable business growth.
Quick look at data driven web design:
- advanced web design technologies
- advanced web development technologies
- custom web application development
What is Data-Driven Web Design?
Data driven web design isn’t about removing creativity; it’s about making smarter, evidence-based decisions. Instead of guessing what works, you build your website on solid proof of what resonates with real people. Every choice—from button placement to color schemes—is informed by how users actually behave.
The shift from traditional, intuition-based design to a data-driven model is fundamental. It’s an objective, user-centric, and scientific methodology that prioritizes continuous improvement.
| Feature | Traditional Design | Data-Driven Design |
|---|---|---|
| Foundation | Intuition, aesthetic trends | Empirical data, user behavior |
| Approach | Subjective, designer-centric | Objective, user-centric |
| Iteration Cycle | Slower, post-launch feedback | Continuous, real-time data |
| Goal | Visual appeal, brand expression | Optimized performance, conversions |
Why does this matter? Because the results are undeniable. Companies excelling in data-driven decisions are 5% more productive and 6% more profitable than competitors. A well-executed UX design can increase conversion rates by up to 400%, and research shows a direct link between data-driven practices and profitability, with ROI for UX reaching as high as 9,900%. This approach is a continuous cycle: collect data, analyze insights, design solutions, test changes, and measure results.
Understanding Your Data: Quantitative vs. Qualitative
Effective data driven web design relies on two types of information working together.
- Quantitative data is the “what.” These are the hard numbers from analytics, such as click-through rates, bounce rates, and conversion metrics. It tells you what is happening at scale. For example, it can show you that 70% of users abandon their cart on a specific page. You can learn more on quantitative research to understand these metrics better.
- Qualitative data is the “why.” This is the human element gathered from user feedback, surveys, and interviews. It explains the reasons behind the numbers—perhaps users are leaving the cart page due to unexpected shipping costs or a confusing form.
Combining both gives you a complete picture. Quantitative data points to a problem, and qualitative data reveals the cause. This holistic view is fundamental to effective UX/UI Design & Conversion Optimization.
Key Tools and Methods for Data-Driven Web Design
Collecting this data is more accessible than ever with the right tools.
- Analytics Tools (e.g., Google Analytics): Your mission control for tracking visitors, their behavior, and conversion funnels.
- Heatmaps and Click Tracking (e.g., Hotjar): These tools visually represent where users click, scroll, and hover. Heat maps use eye tracking to understand where users are looking on a screen, revealing what grabs their attention and what gets ignored.
- A/B Testing: This method lets you test variations of an element (like a headline or button) with real users to see which performs better. For more complex changes, multivariate testing analyzes multiple elements at once.
- User Surveys and Interviews: These provide direct qualitative feedback, uncovering user thoughts, frustrations, and motivations.
These tools are essential to our work as a Conversion Rate Optimization Consultant, ensuring our recommendations are based on evidence.
From Insights to Action: Applying Data to Improve UX
The real value of data driven web design is turning insights into tangible improvements. The process involves identifying patterns in your data—like a high drop-off rate on a specific page—and then using qualitative data to understand the “why.”
This insight-driven approach allows for targeted improvements:
- Improving Layout: Adjusting visual hierarchy and content placement to guide user attention where it matters most.
- Optimizing User Flow: Streamlining the user journey by removing friction points identified in conversion funnels.
- Enhancing Navigation: Refining menus and labels based on click tracking and user feedback to make your site effortless to steer.
For example, Virgin America used A/B testing to redesign its website, resulting in a 14% increase in conversions and 20% fewer support calls. This is the power of letting data guide decisions. We apply these same principles to create SEO Optimized Websites that convert visitors into loyal customers.
Mastering the Craft: Balancing Data, Creativity, and Business Goals
Data driven web design is powerful, but it’s not the whole story. The real magic happens when you balance insights with creativity, intuition, and clear business goals. Data is your compass—it points you in the right direction, but you still need artistry to create something remarkable.
Real-World Success: Examples from Industry Leaders
The world’s most successful companies master this balance to achieve digital dominance.
- Amazon built its empire on data, using it to power its personalization engine and one-click purchasing, which was refined through relentless A/B testing.
- Netflix constantly tests its interface, personalizing everything from content categories to the thumbnail images you see, all based on your viewing habits.
- Spotify uses listening data to create its famous “Find Weekly” playlists and continuously refines its UI through rigorous testing.
A key philosophy comes from Booking.com: “informed by data, driven by empathy”. They collect massive amounts of data but never forget the real people behind the numbers. This is the approach we take at Hyper Web Design—using data to inform decisions while always focusing on the human experience.
Navigating Challenges and Balancing with Creativity
Working with data isn’t always straightforward. It’s crucial to steer potential pitfalls:
- Misleading Data: Numbers show what happened, but not always why. A drop in conversions could be due to a design change or an external factor like a competitor’s sale. Misinterpreting data can lead you down the wrong path.
- Information Overload: It’s easy to drown in metrics. The key is to focus on the key performance indicators (KPIs) that directly align with your business goals.
- Privacy Concerns: Collecting user data is a responsibility. We adhere to regulations like GDPR compliance by collecting only what’s necessary and being transparent about its use.
The most important balance is between data and creativity. Data is excellent for optimization, but intuition and creativity play a crucial role in innovative design. This is why we advocate for being “data-informed” rather than “data-driven.” Data is a critical input, but it’s combined with experience, empathy, and creative instinct to produce breakthrough solutions.
Driving Business Growth with Data-Driven Web Design
Data driven web design is about driving measurable business growth. Every design decision is tied back to your KPIs.
- Conversion Rates: A well-designed UX can increase conversions by up to 400%, turning more visitors into customers.
- User Engagement: By tracking metrics like time on site and pages per visit, we can create more engaging content and experiences.
- Customer Lifetime Value: A seamless, enjoyable website experience builds loyalty and encourages repeat business.
- Reduced Bounce Rates: Data helps us identify and fix the issues that cause visitors to leave prematurely.
The future is even more exciting, with AI enabling sophisticated, real-time personalization. At Hyper Web Design, our Custom Web Design Services already integrate these principles, combining data analysis with luxury design to create websites that perform exceptionally and drive business growth.
Conclusion
We’ve seen that data driven web design is a scientific, user-centric approach that moves beyond aesthetics to deliver proven results. By combining quantitative data (the “what”) with qualitative insights (the “why”), we gain a complete picture of the user experience.
However, data is not the whole story. As the success of companies like Amazon and Netflix shows, the true power lies in balancing data with human expertise. The best approach is to be “informed by data, driven by empathy.” Data shows us where users struggle, but it takes creativity and intuition to transform those insights into exceptional experiences.
This transforms your website from a guessing game into a precision instrument for achieving business goals. When 75% of visitors judge your credibility based on site design, you can’t afford to rely on hunches. Companies that accept data-driven decisions are more productive and profitable, giving them a critical edge.
To create a truly impactful digital presence, a data-driven approach is no longer optional—it’s essential for growth. Your website should be your most powerful business tool. Transform your online presence into a high-performing asset with our expert Web Design Services.


